On January 26, 1700, a tsunami struck Japan. We know this from written records describing the coastal inundation. Yet what’s most notable about these records is what they don’t describe. Tsunamis are the result of water displaced by earthquakes, but the 1700 tsunami didn’t correlate to any quake felt in Japan–there was no warning tremor. Instead, this “orphan tsunami” was the result of a massive earthquake all the way across the Pacific Ocean, off the coast of present-day Oregon and Washington. The same event is traceable in the oral traditions of the Indigenous people of the Pacific Northwest which contain accounts of shaking Earth and floods. And also in the tree rings of long-drowned ghost forests, which suddenly died before the start of the 1700 growing season.
The quake was an estimated magnitude 9, a catastrophic event for the Pacific Northwest according to the stories which tell of entire settlements and tribes disappearing, and among the largest known quakes in human history. Through modern-day geological analysis, it’s now well-established that the 1700 quake was one of more than 40 significant tremors to shake the region over the past 10,000 years, and one of about twenty earthquakes of magnitude 9 or greater from the same time period. Each was the result of the Cascadia subduction zone, a ~600-mile-long fault line running from southern British Columbia to Northern California. Along the fault, the small oceanic Juan de Fuca tectonic plate is sliding below and forcing upwards the much larger North American plate, building up friction and pressure pending an inevitable burst.
For more than a decade, seismologists have warned that another quake is on its way. Averaged over time, big quakes (about a magnitude 8 or larger) in the region have occurred approximately every 230 years, while the even larger ones (magnitude 9 and above) have happened about every 500 years. We’re at more than 324 years since the last one. And though the sudden shifts and ruptures that cause earthquakes don’t come like clockwork, they do come eventually.
A new study offers a deeper glimpse into two colliding tectonic plates than we’ve ever had before. The research, published June 7 in the journal Science Advances, includes imagery of the lower plate’s terrain and confirms segmentation of the whole subduction zone into smaller chunks. The data and analysis will be instrumental to improving forecasts of future quakes and tsunamis, and help prepare the Pacific Northwest for its seismic fate.
It provides an “unprecedentedly detailed view of the Cascadia [fault], which we know has the potential to host large earthquakes,” Erin Wirth, a research geophysicist at the U.S. Geological Survey in Seattle who was uninvolved in the new work, tells Popular Science. “These results are going to be critical inputs for future earthquake and tsunami models,” she says.
For 41 days in 2021, members of the study team were at sea aboard a sophisticated research vessel, with an array of thousands of underwater recording devices trailing for miles behind the ship. They shot powerful sound pulses towards and through the seafloor, collecting the echoes with their bevvy of sensitive hydrophones. Based on the strength and timing of those return signals, the scientists were able to suss out the topography and features of much of the fault, explains Harold Tobin, a study co-author and professor of geophysics at the University of Washington. “It works in an analogous way to radar,” he notes.
But though the gist of the methods may have been simple, analyzing the vast quantity of information they collected hasn’t been. “It’s supercomputer-level work to do all the processing. That’s one of the reasons why the paper is [only] coming out now,” Tobin adds. He expects this study to be the first of many, as he, his colleagues, and other scientists dig further into the dataset.
This paper “is really just scratching the surface,” agrees Chris Goldfinger, a professor of marine geology at Oregon State University. Goldfinger wasn’t involved in the new study, but is one of the world’s foremost experts on the Cascadia subduction zone. “They’ve done a tremendous amount of work, but the dataset has much more depth to it. New things will come out of it for decades to come,” he says.
On this initial toe dip in the data pool, Tobin and his co-authors have already identified some important results. For one, their analysis confirms the pre-existing theory that smaller, horizontal faults cut through both the upper and lower plates, splitting the subduction zone into segments. (Exactly how many segments depends on how the divides are defined, but it’s somewhere between three and five.) In an earthquake event, any number of these segments might be involved, and the more that slip at once, the larger the affected region, tremor magnitude, and scale of catastrophe is likely to be.

Another key finding: The segment (or segments, depending on how you slice it) of the Juan de Fuca plate off the coast of Washington is very smooth and flat, says Wirth. “Counterintuitively, a fault that is smoother at the boundary between two plates has the potential for larger earthquakes than a fault that is rougher,” he adds. Smooth means more contact between the plates, more friction over a larger area, and fewer geologic features impeding the spread of a slip event. When that Washington segment goes, it will be especially dramatic. “We can infer it represents the largest part of the hazard of a future earthquake rupture,” he says.
The study also provides finer-scale information about the subduction zone, including the fault depth throughout the area. In many regions along the fault, the new data shows that the fault is shallower (i.e. closer to the seafloor surface) than previously thought. “That can possibly have an impact on ground shaking and tsunami hazard,” says Wirth. “The closer you are to a fault or the closer the fault is to the surface, the stronger the ground shaking could be and also potentially the greater the tsunami generation could be.” Though, she emphasizes, more analysis and quantification is needed to better understand the exact effects of this–and every observation in the study. That’s where the models will come in.
“There’s no guarantee of exactly what the next event will do,” says Tobin. The big one (or really big one) “could happen tomorrow–but it could also be literally centuries in the future…The more you know, the more you can build a guide.”
Already, Wirth and her USGS colleagues are beginning to add this new information into their simulations. Eventually the outcomes of those computer test-runs will be used by hazard researchers to make more accurate shake maps, by engineers to test building design and responses, and by local and state governments to decide building codes.
Though unprecedented in its scale and depth and instrumental to improving future models, even the new still data has limits. It is missing imagery from the section of the fault closest to the coastline, says Writh, which is “pretty important” when it comes to forecasting quake impacts. And the boat’s path leaves about 50 kilometers between each data collection track along the study zone, says Goldfinger. From past work, it’s possible to fill in those 50km gaps with some information, but nothing nearly as detailed as the new data. “It’s a very good data set,” he says, but “the line spacing of 50 km is pretty big, and there’s a lot of stuff going on in between that we still can’t see.”
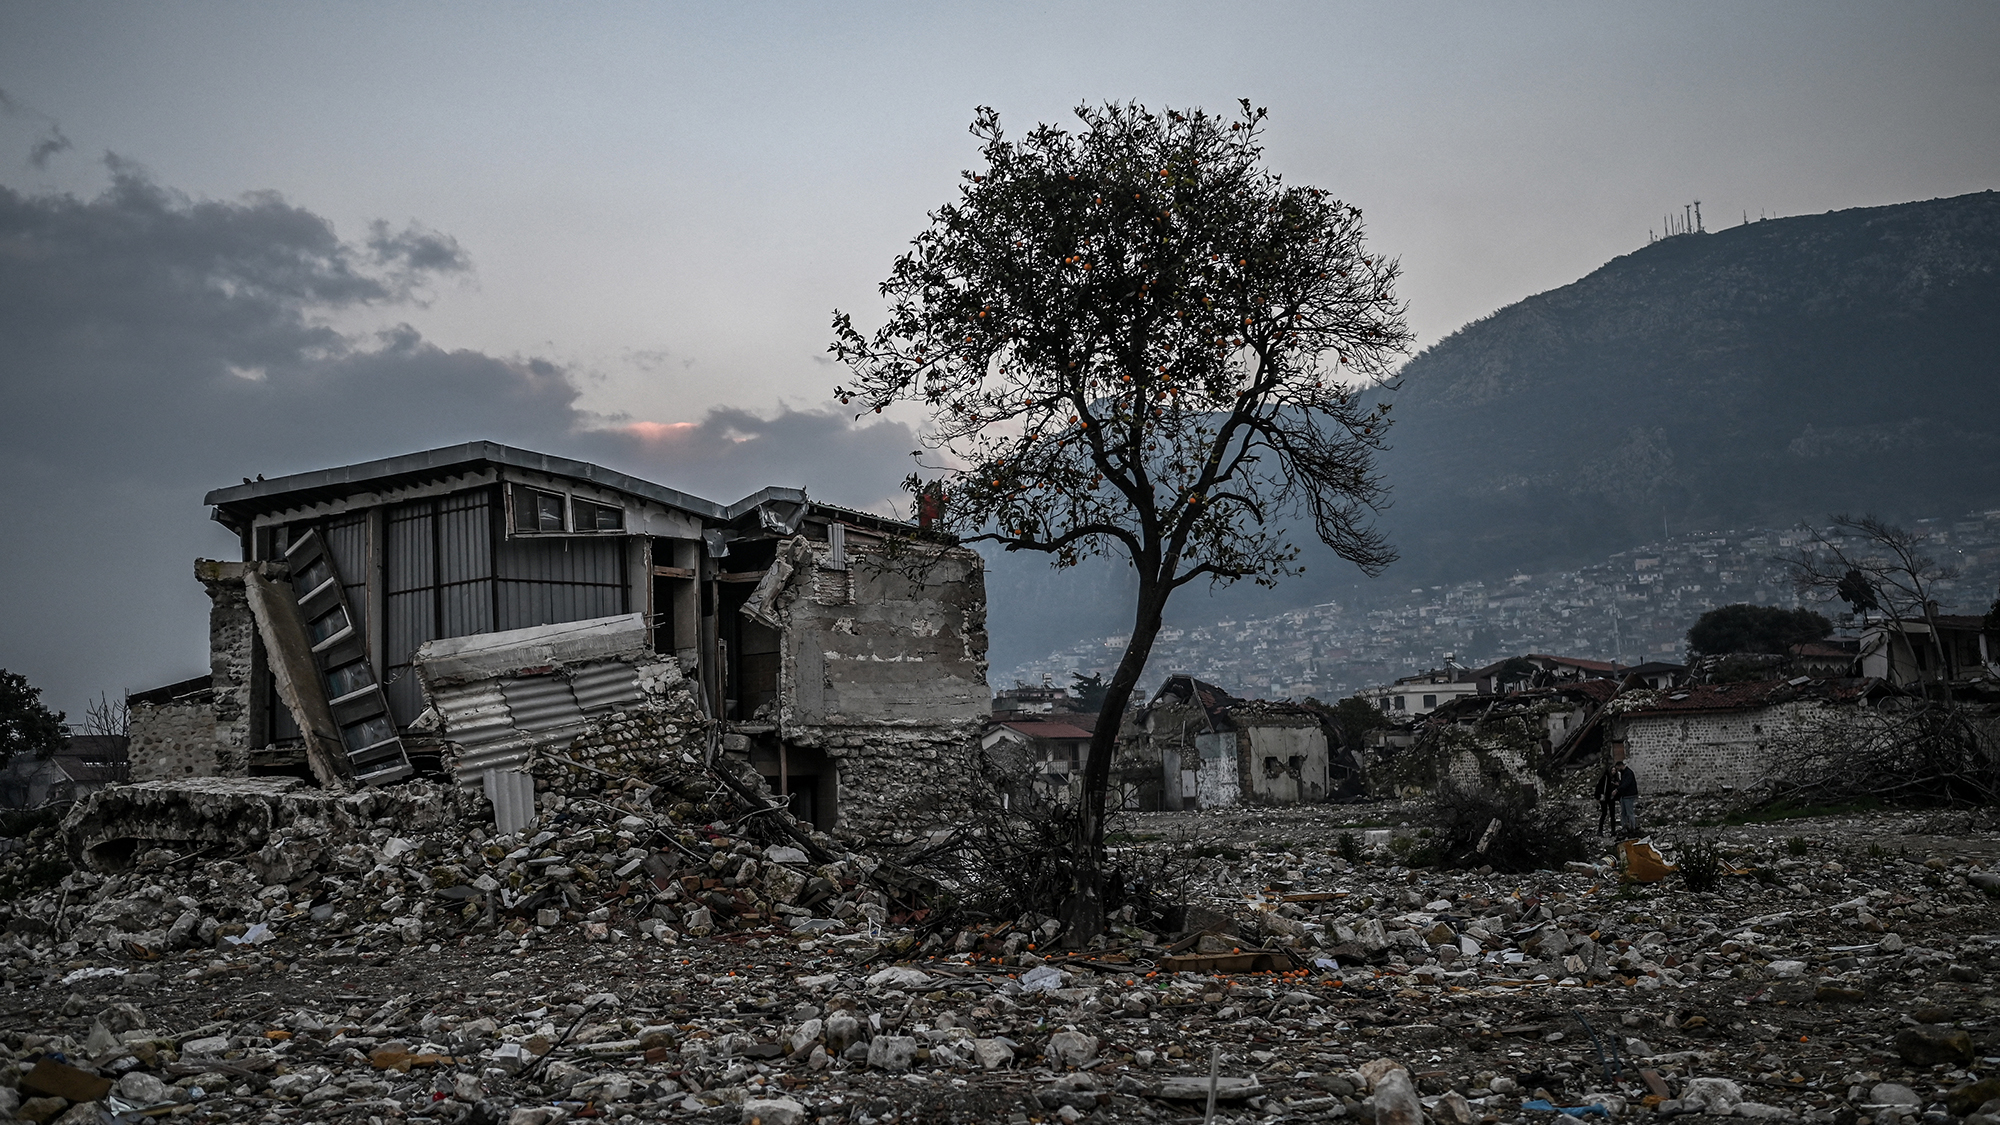
Yet we don’t really need any more data to know that the Pacific Northwest is still woefully unprepared for the possibility of a major earthquake. “The science consensus is strong enough that the story is not going to fundamentally change,” says Goldfinger. “We’re in this situation where we’ve discovered a ticking time bomb [beneath] fragile cities.” . Some grassroots efforts to retrofit schools and build tsunami evacuation towers have been successful in recent years, but Oregon and Washington remain significantly behind other quake-prone places like Japan and even neighboring California. People tend to think “collapsing buildings are limited to Turkey or Haiti– places that have no building codes,” says Goldfinger. “But the Pacific Northwest is in the same boat as Turkey and Haiti because we didn’t have building codes that were up to snuff until 1994.”
There are eminently collapsable, unreinforced masonry buildings all over Seattle, Portland, Tacoma, and the other major cities in the quake zone. There are schools along the coast within the tsunami inundation area with no available evacuation route. Even the standard advice for how to best protect yourself in a quake likely doesn’t apply to many of the places and people at risk in the Cascadia zone, says Goldfinger. “We’ve got a very fragile infrastructure and a coming big earthquake. What are we supposed to tell people about that?”